Since July 2020, fathers in the Netherlands have been entitled to five weeks of additional paid birth leave — aanvullend geboorteverlof (AGV) — paid at 70 percent of the daily wage, up to a statutory cap. Fifty-nine percent of eligible fathers take it, but take-up is lowest at both ends of the income distribution — among the lowest- and the highest-earning fathers alike.
English Summary
We measure take-up by linking CBS birth records to UWV records of AGV benefit payments, covering births from July 2020 to June 2023. The sample is legal fathers with an employment contract around the month of birth: 361,031 births to 331,998 fathers.
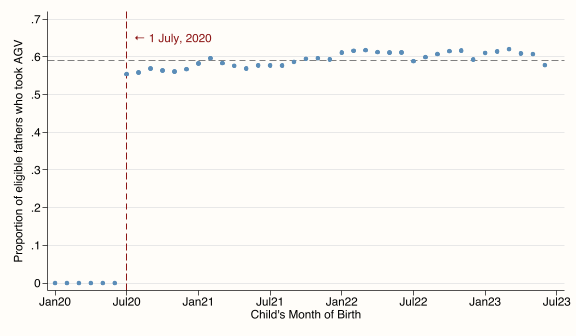
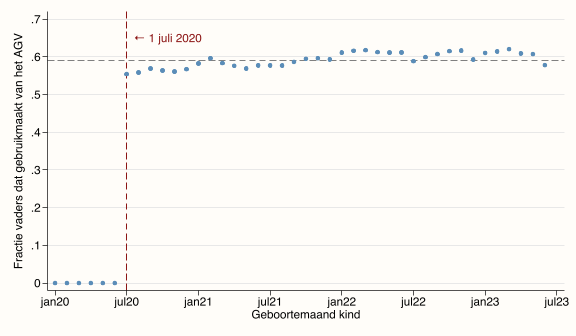
Take-up rose sharply after the July 2020 introduction and then held steady (Figure 1). Most fathers who take AGV use the full five weeks. Administrative take-up is lower than survey-based estimates, which likely overstate use through selective response, social desirability, or confusion between leave schemes.
The income gradient is U-shaped (Figure 2). Take-up is 37 percent in the bottom decile, rises to about 64 percent through the middle of the distribution, and falls back to 44 percent among the top five percent.
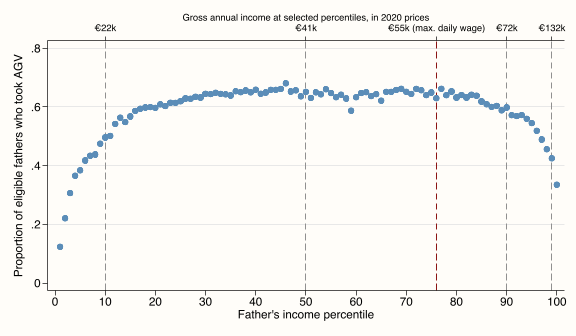
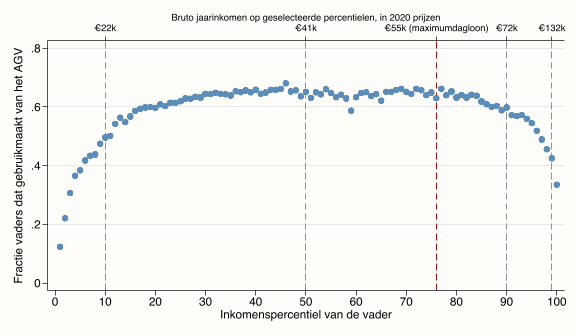
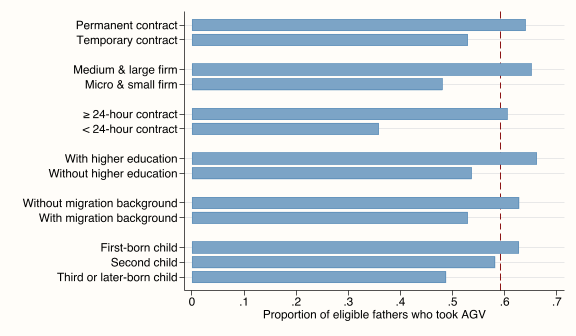
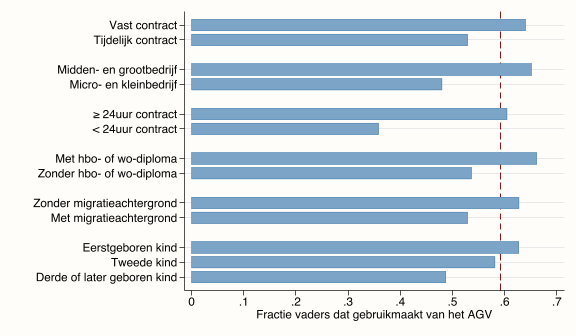
The two ends likely reflect different barriers: lost income deters low earners, while the wage cap and higher opportunity costs deter top earners. Take-up is also lower among fathers on temporary or small contracts, with fewer contract hours, without higher education, with a migration background, and with third or later-born children (Figure 3). These are descriptive patterns, not causal estimates — but they show where access to leave is uneven.
Additional Results
These interactive figures add geographic and industry detail beyond the print article; each has an EN/NL toggle.
The map shades each municipality by its take-up rate (Figure 4). Click one for its rate and a 95 percent confidence interval. Read it as orientation rather than evidence — rates in small municipalities are noisy, so the national pattern matters more than any single place.

The ranking across two-digit SBI industries echoes the income, contract, and hours gradients above (Figure 5). Industries built on low-paid, temporary, or part-time work, such as hospitality, sit at the bottom, so it largely restates the earlier patterns rather than adding a new one.